Bibliometric analysis has range of applications, a practical application is analyzing a research institution or department; such as in terms of topics, collaborations (both internal and external) and impact (in the form of citations) in the scientific community.
To illustrate, I constructed a search term based on the names (surname and first initial) of all currently employed at BI’s department of leadership and Organization, and limited results to those attributed to the school. This last criteria serves two purposes, the first is that it limits false hits, where researchers with the same name, but different institution are included, and second, that professors who have a 20% position, are only attributed with the research they have down while at the school.
The dataset is not complete, in that it only includes work indexed by ISI web of science. I limited the maps to those with two or more articles, meaning that co-authors who have only been involved once with someone at BI, are not included, nor are researchers at the department who have only published a single paper (When comparing the map shown, with one that has all co-authorship, the maps look the same, but is more cluttered).
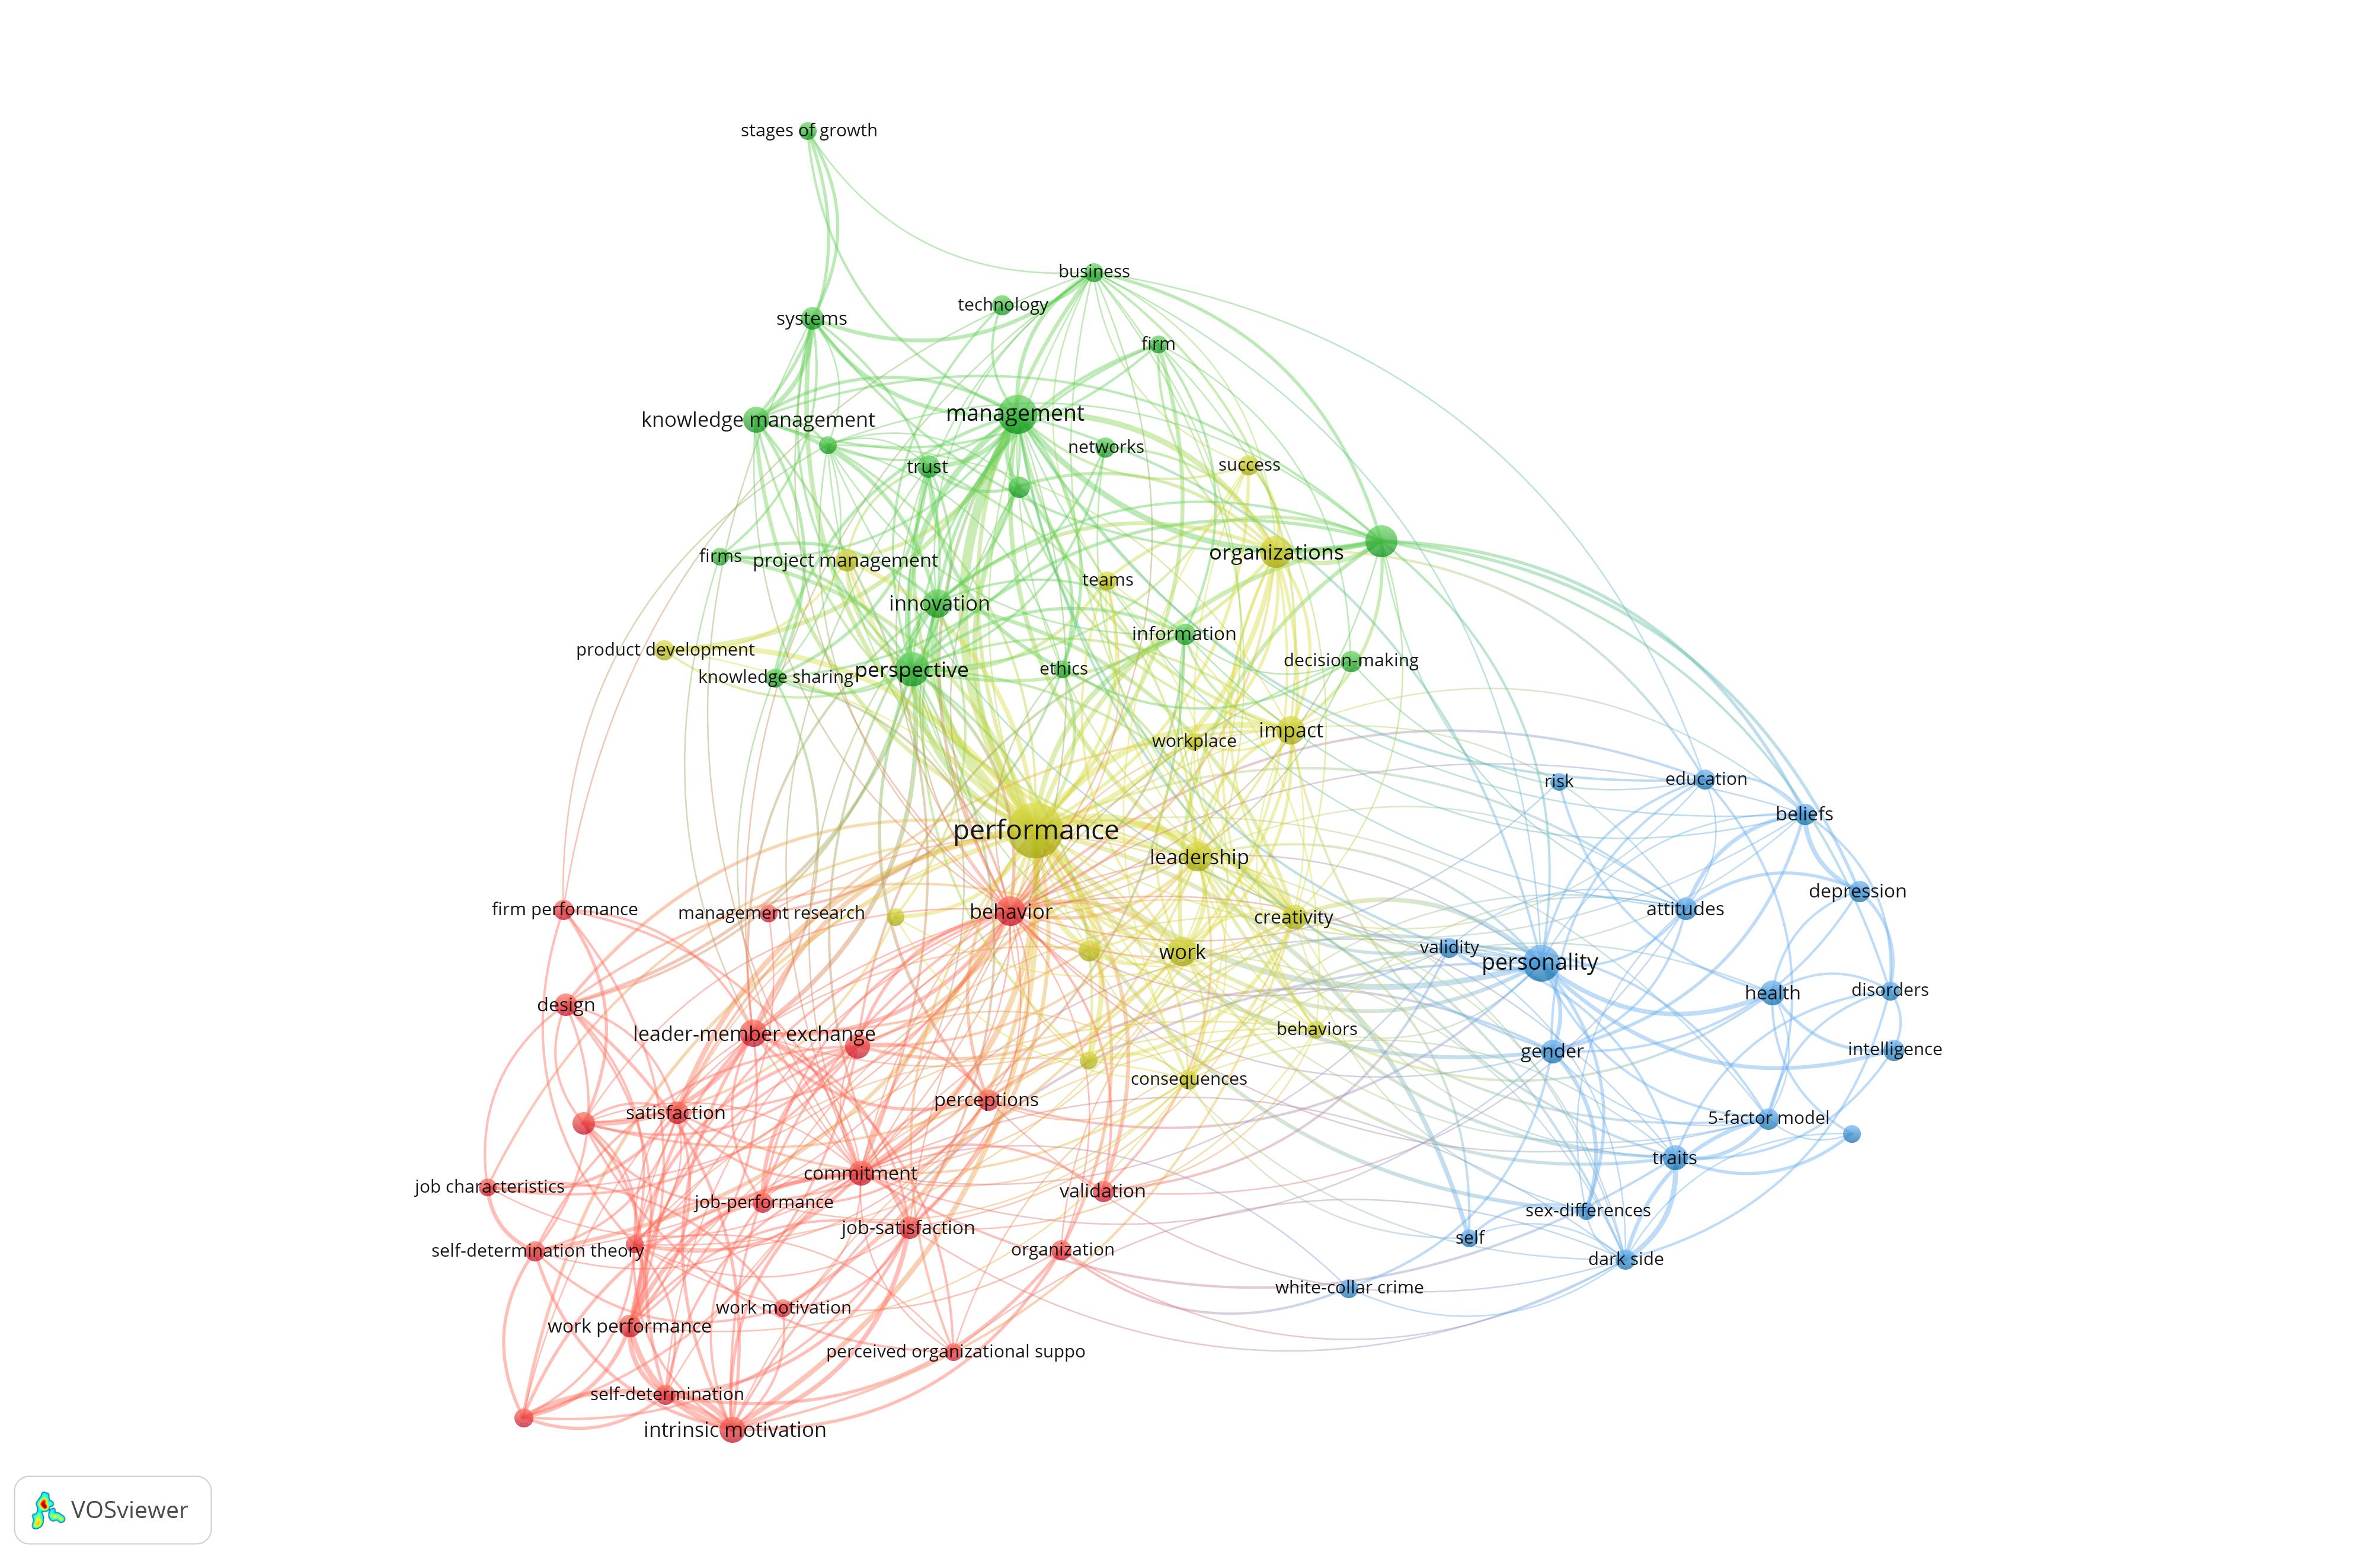
The first map shows keywords of articles published, grouped in four clusters, and to a large degree maps the organization of the department, where green seems to be dominated with words associated with the project management group, the red with the organizational behavour group, the yellow and blue with leadership (and shows the departments growing focus on psychology). Note that the size of the circle is associated with number of occurrences.
 MAP
MAP
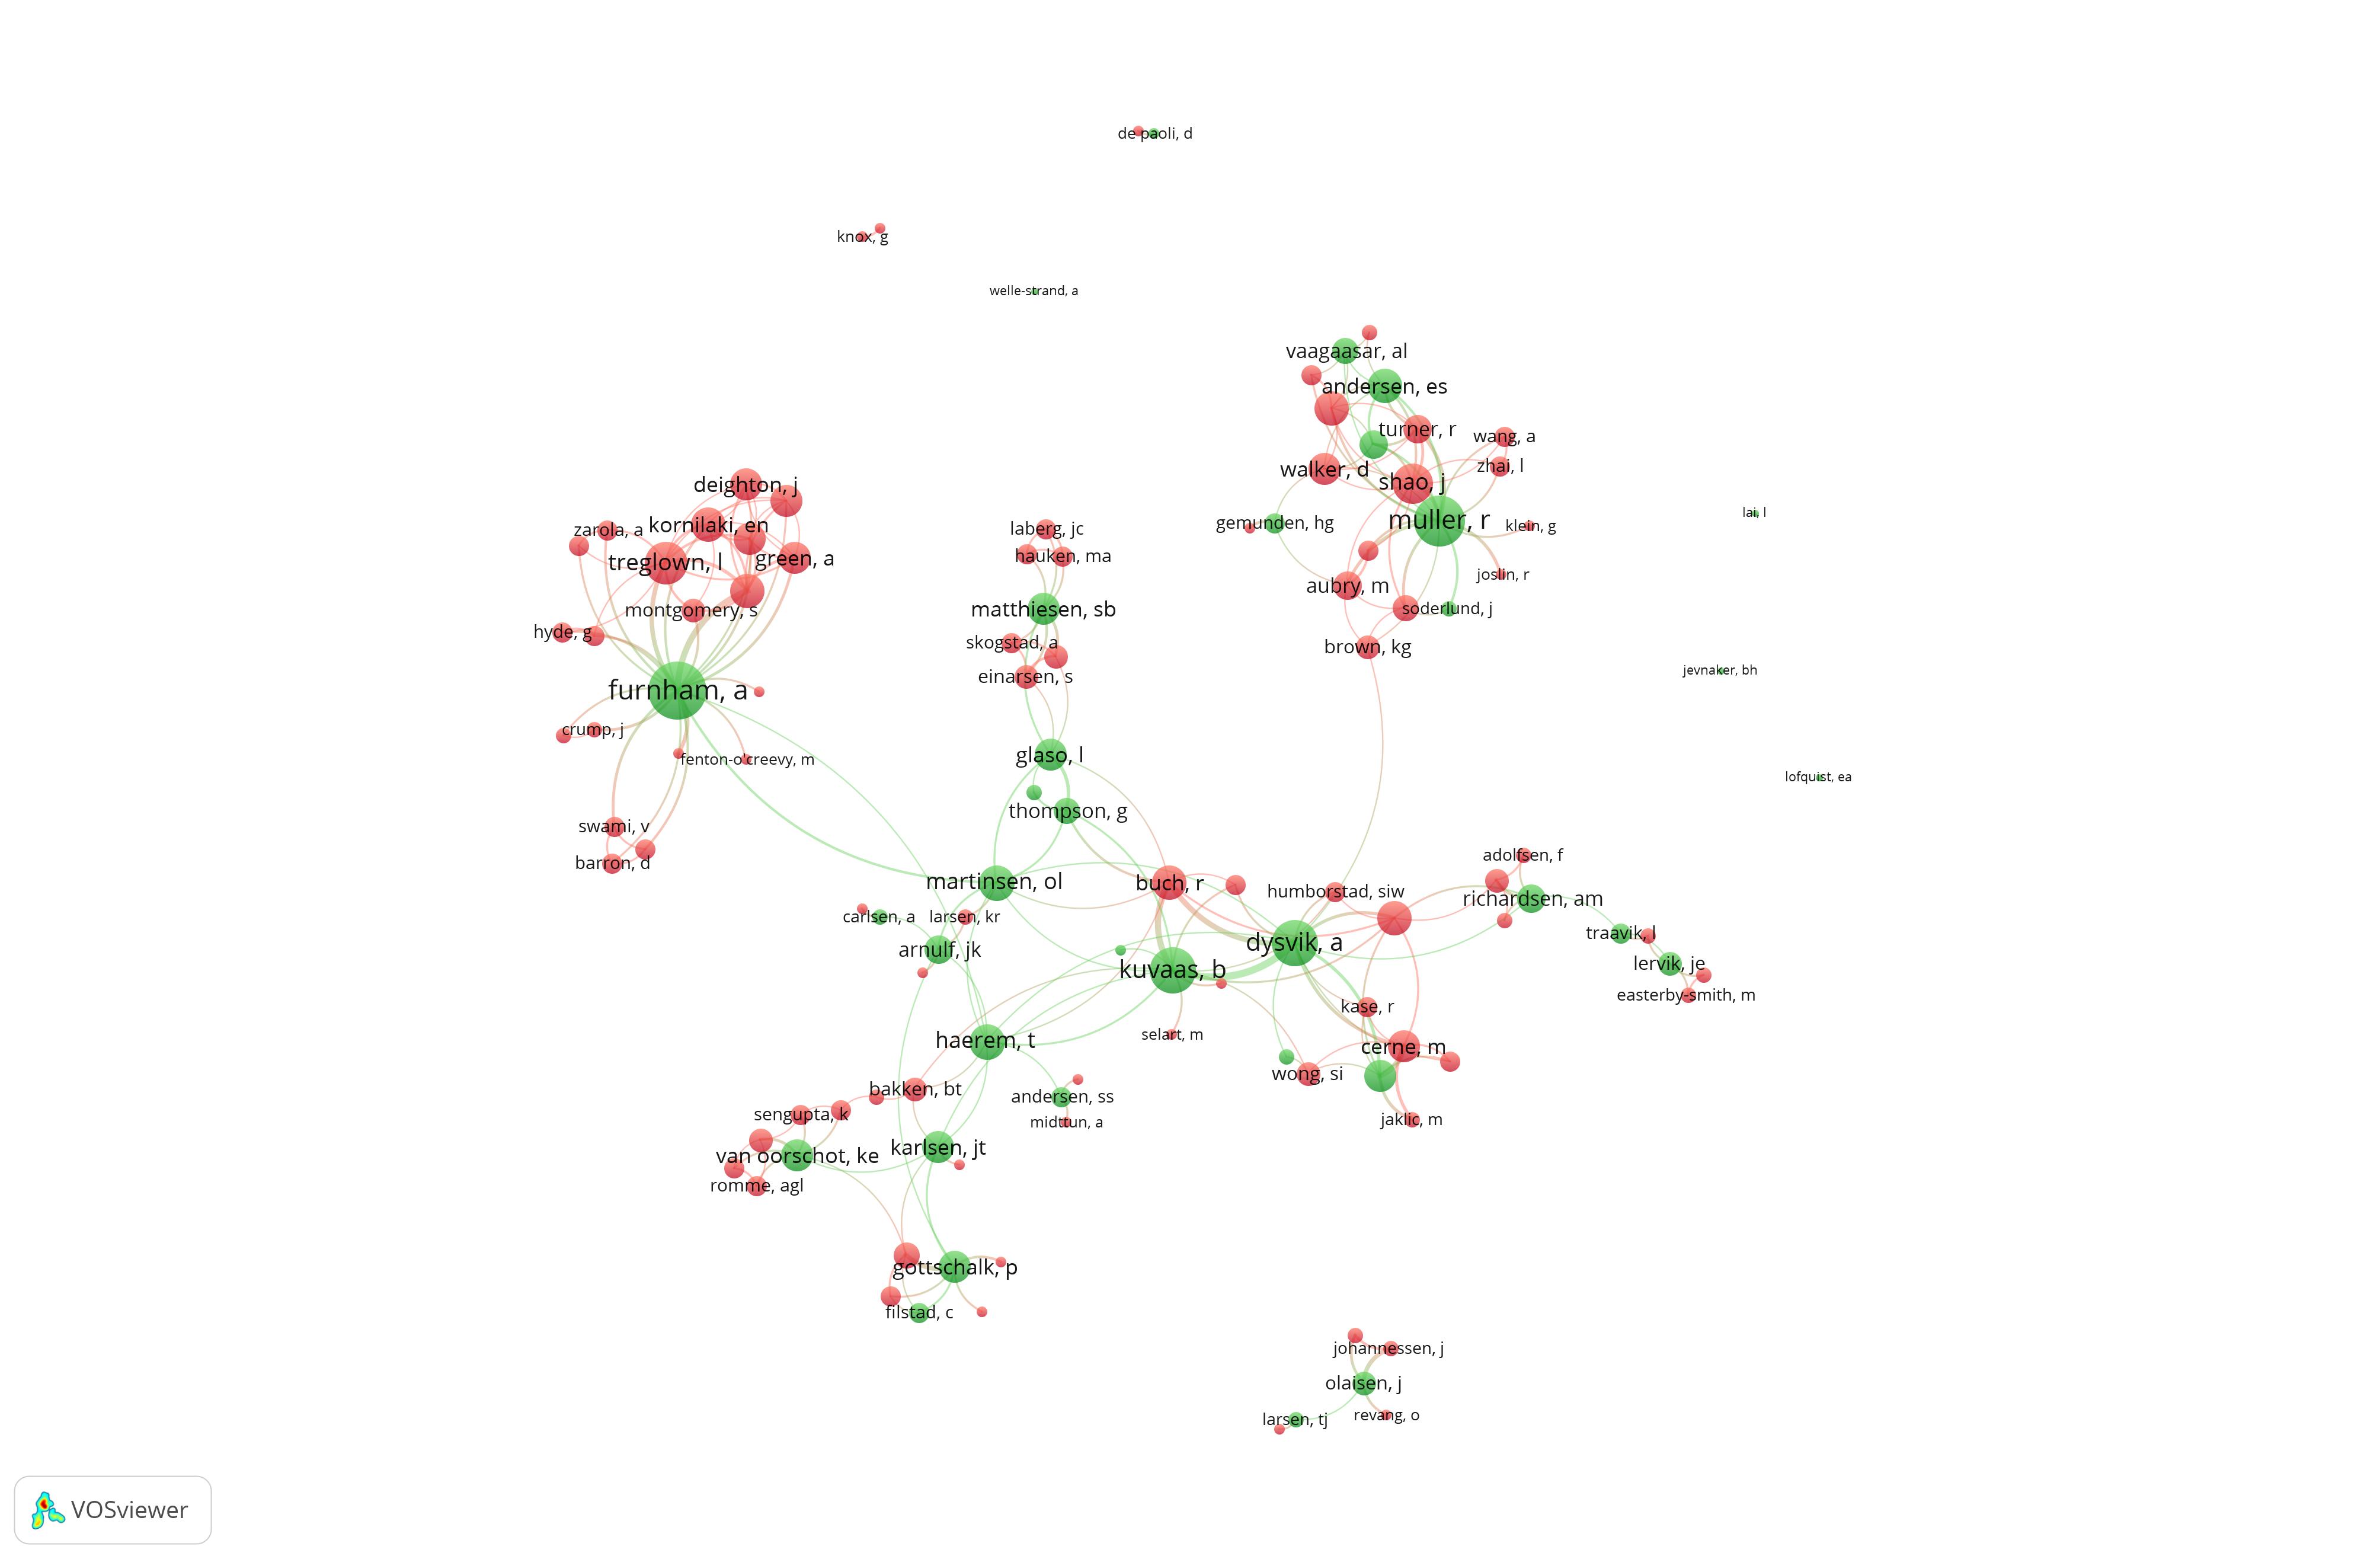
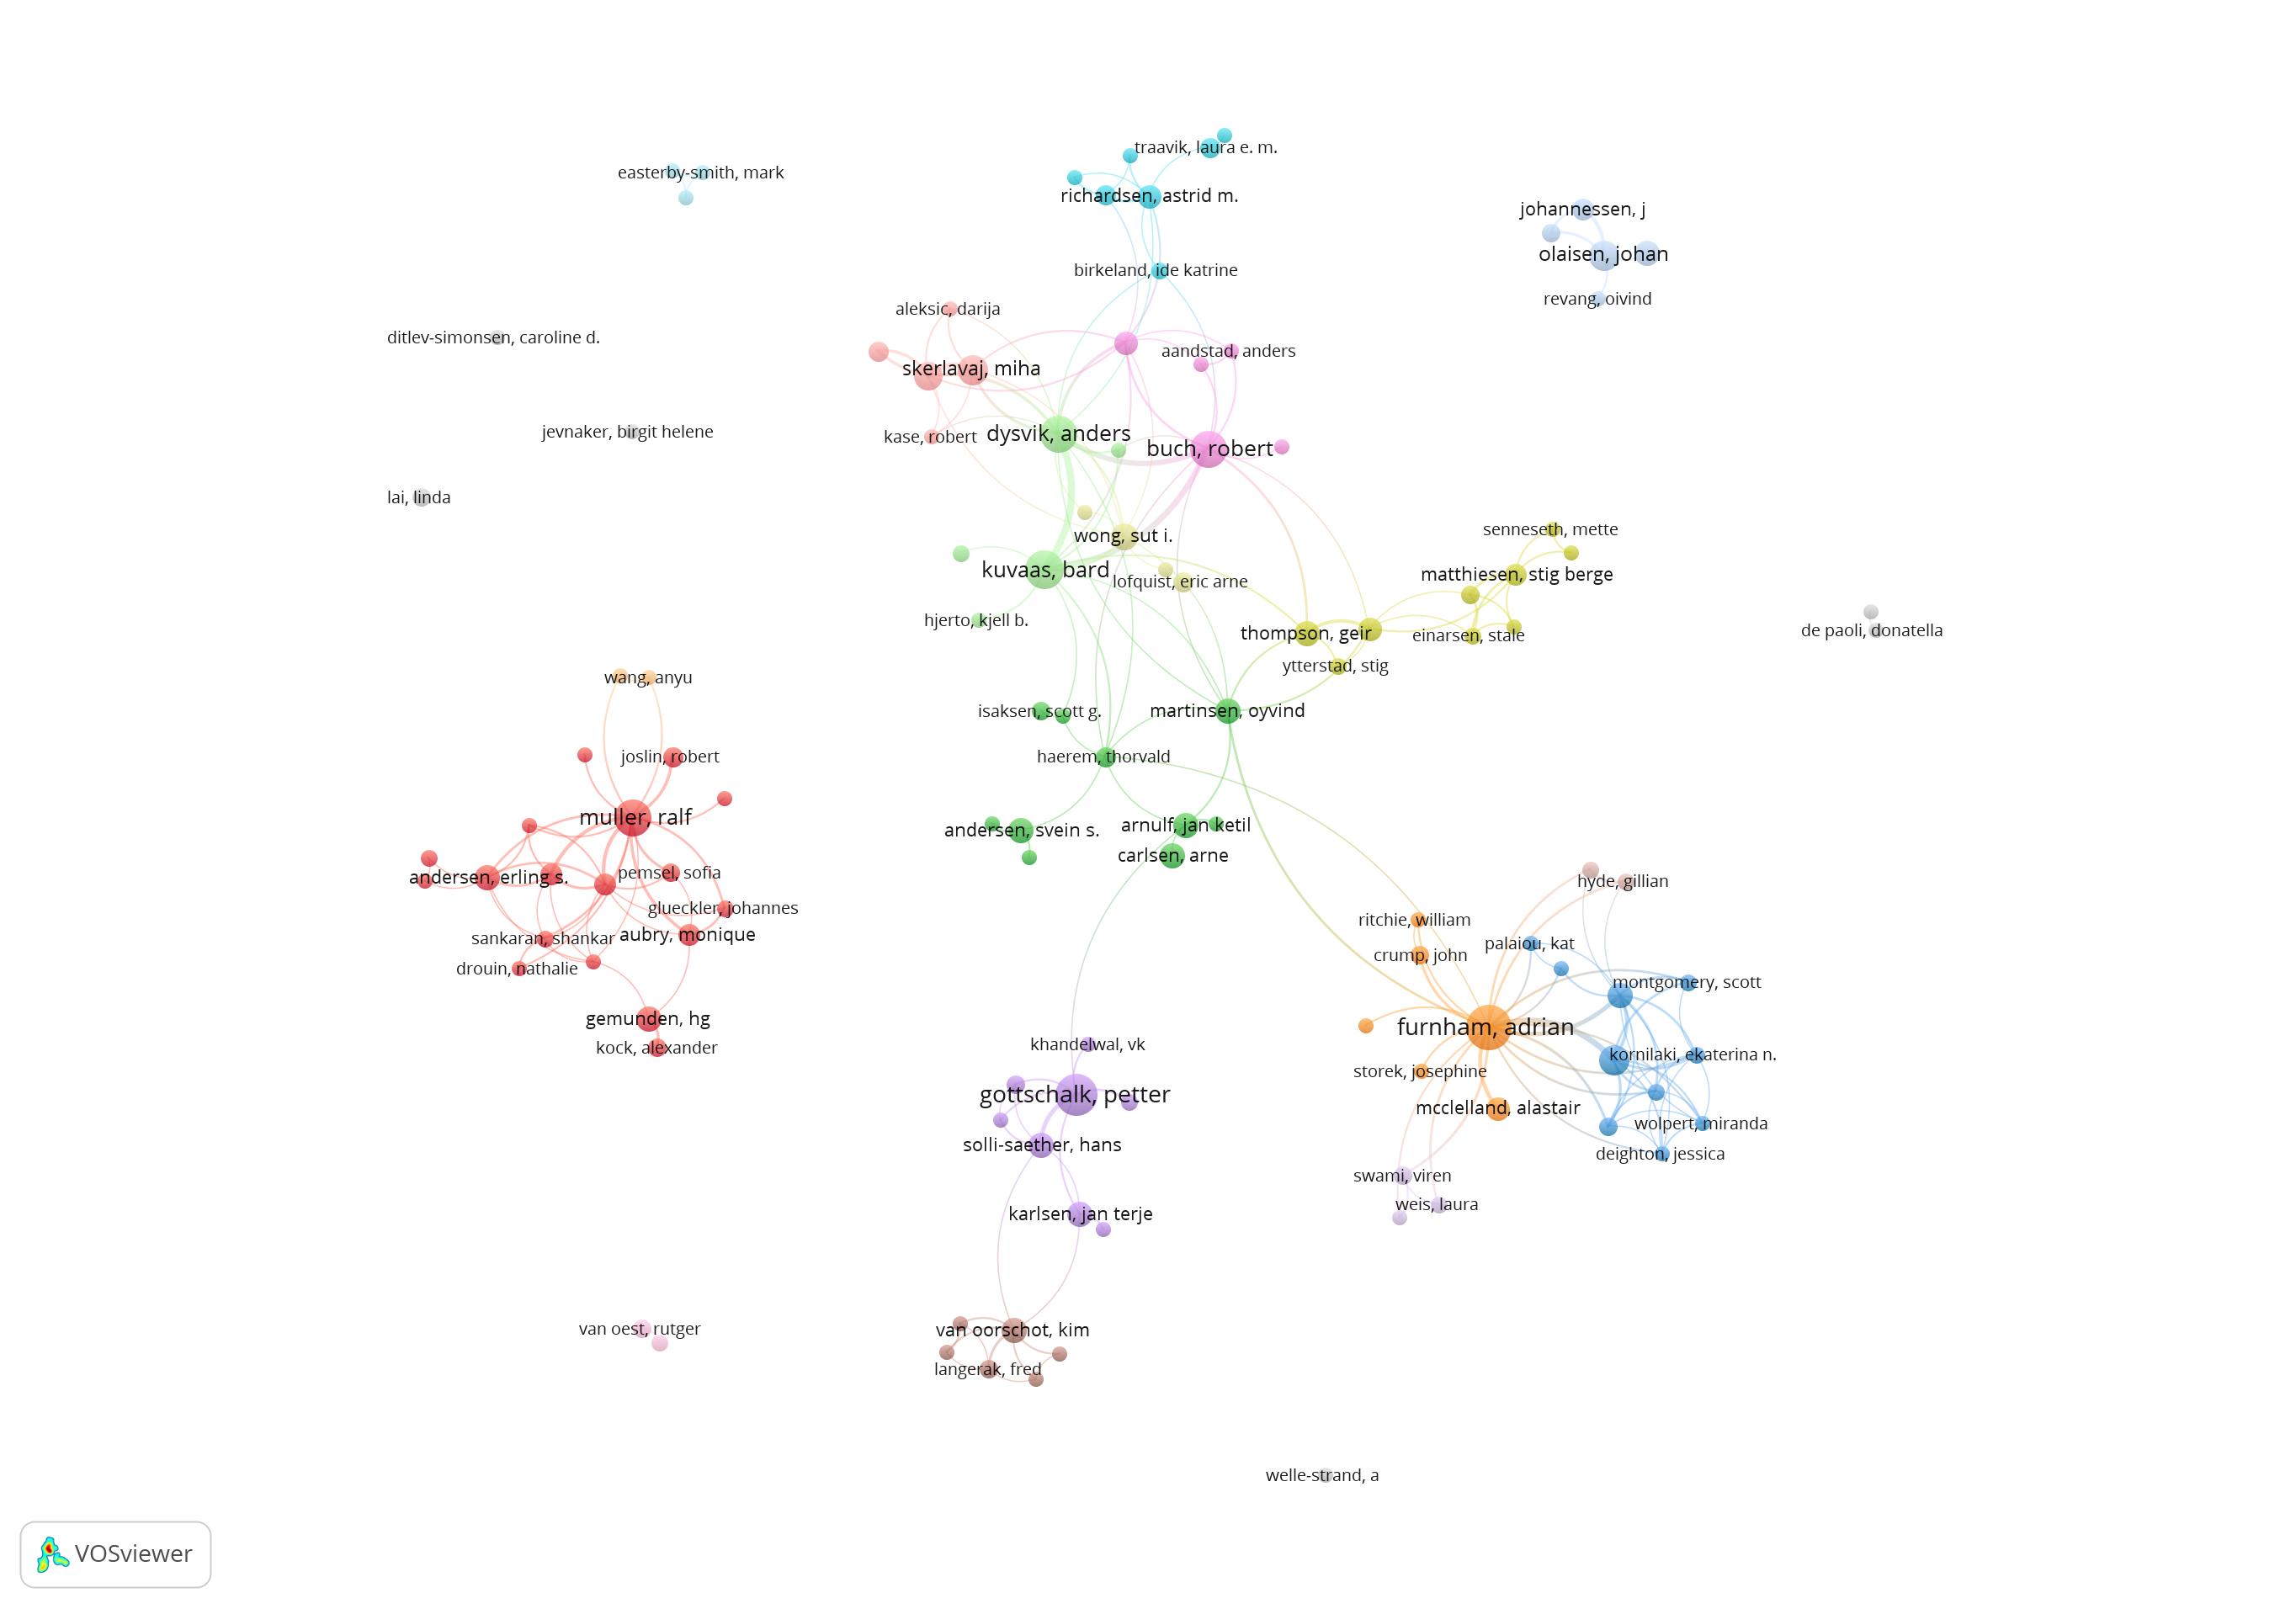
A second map show the co-authorship networks at the department, where all co-authors are included; both those at BI, and collaborators elsewhere. The maps shows there are many small clusters, in a relatively disconnected graph. The size of the circles show the normalized number of citations of each author, as an indication of impact, and the weight of the lines indicate how often two researchers co-author.
Taking a note from one of the other posts on bibliometrics, where I showed that the superstar academics are those who collaborate widely, and tap into many different research groups, I have re-colored the graph, where those in green are currently employed at BI, while those in red are outside.