Bibliometric analysis is taking off, fueled by increasingly easy to use software. While R can have a daunting learning curve, there are some great packages available for those interested. One is Bibliometrix. The command line side of it offers some great flexibility in analysis, though is cumbersome to use, especially when it comes to data-cleaning. However, the possibilities promise rewards.
A great draw to the package is the associated package of Biblioshiny, which launches a point and click interface in a browser, which allows you to explore a dataset. The drawback is that you can not clean the data through the interface.. but you can do a lot of other exploring.
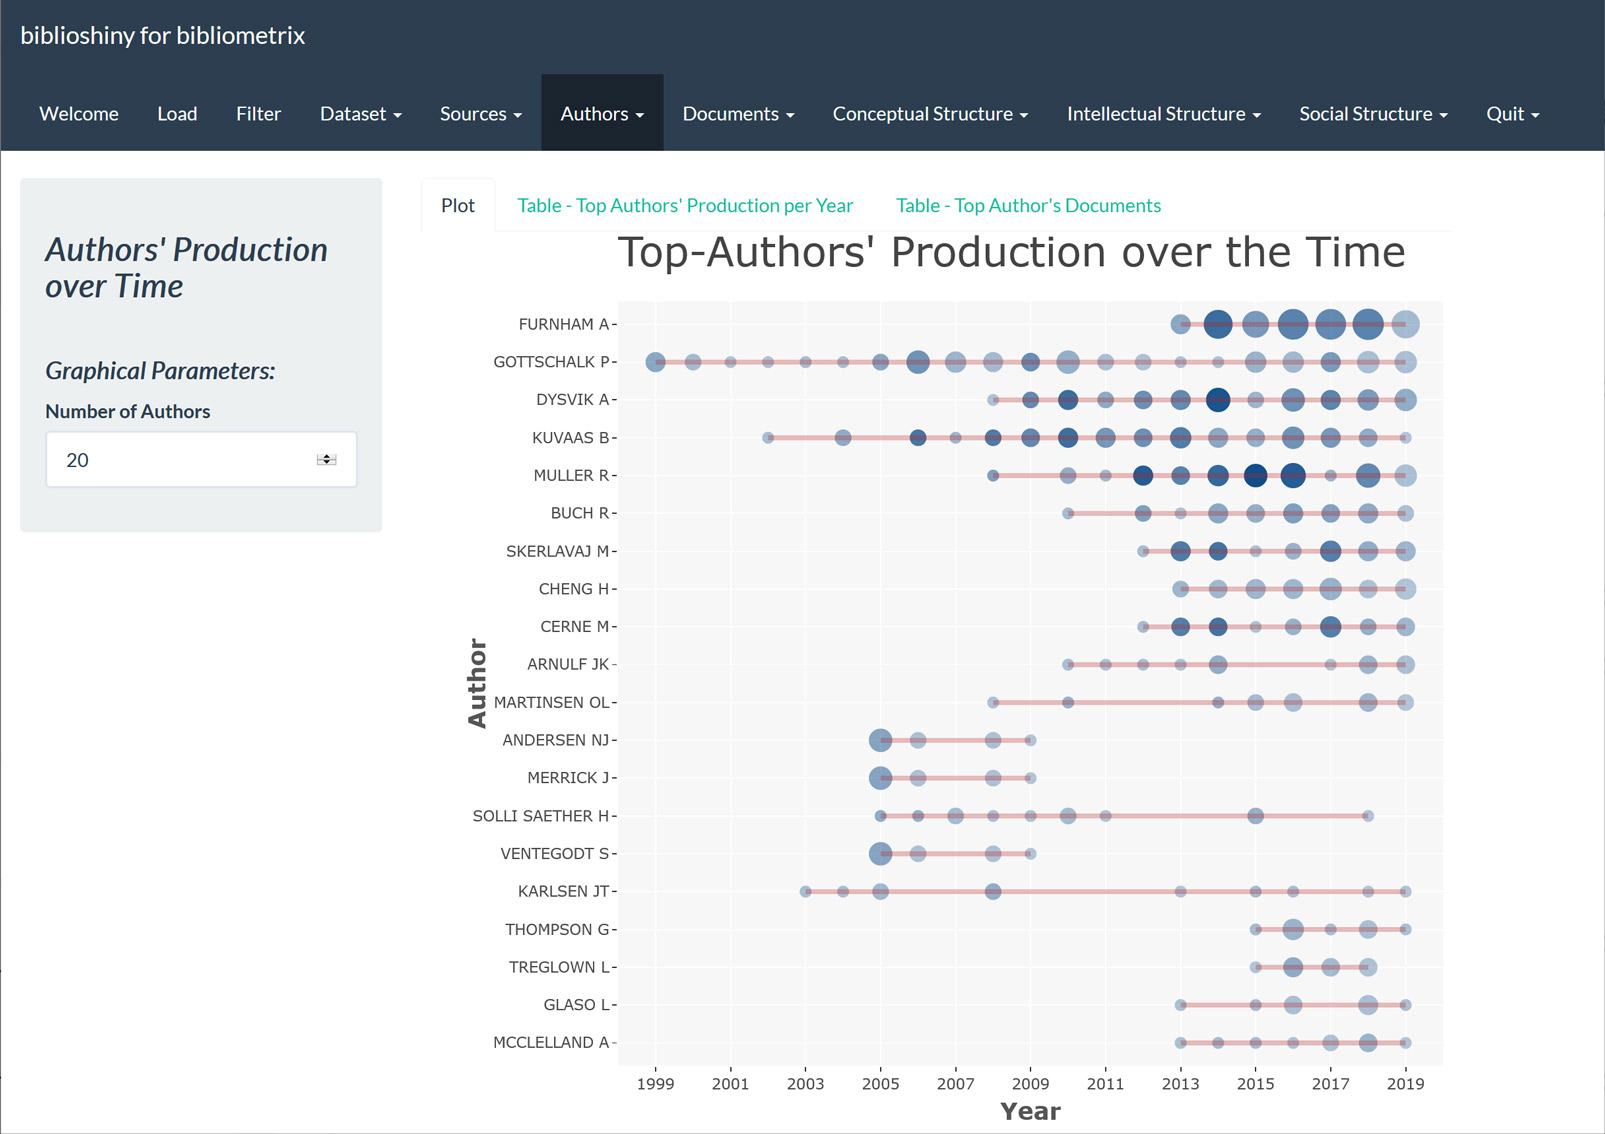
For example, identify the annual production of authors,
And create dendograms / hierarchical clustering of keywords. Great to get a visual idea of the optimal number of clusters in a dataset.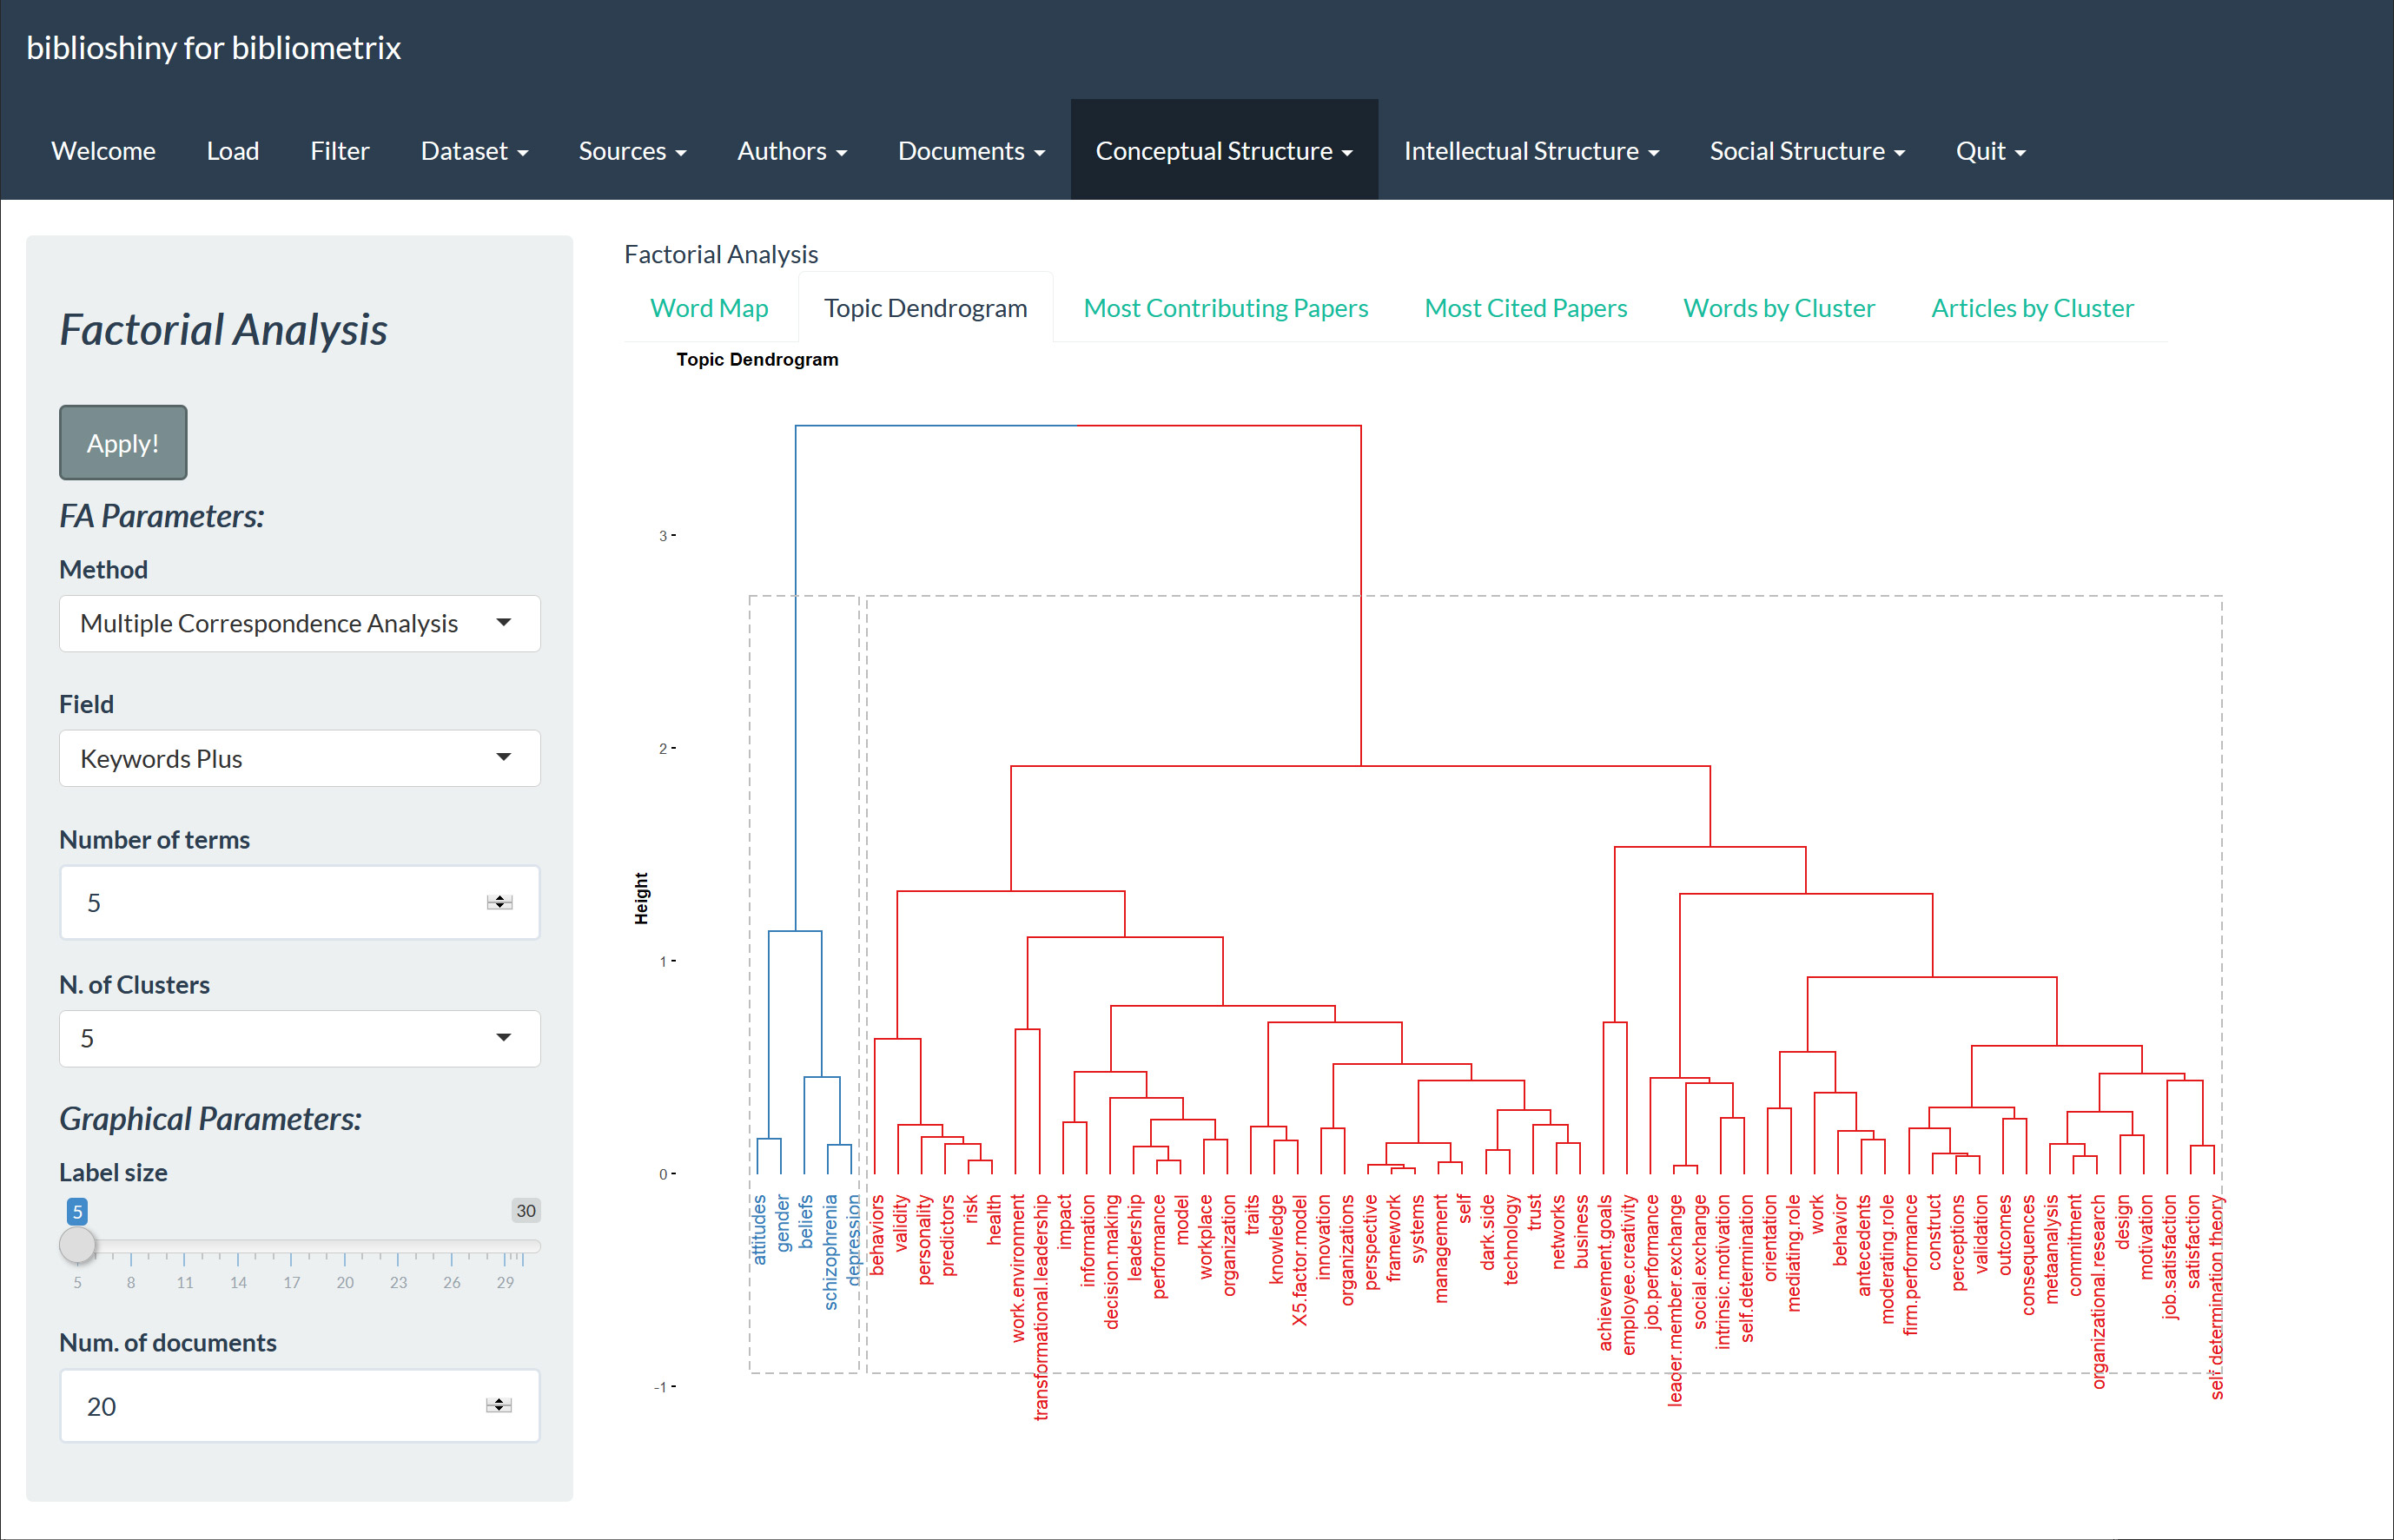
There is also the option to animate the results, though this requires the use of yet another package. The animation include the type as shown in the popular TED talks by Hans Rosling.
Bibliometrix and biblioshiny – R packages
A presentation of biblioshiny: http://bibliometrix.org/biblioshiny/
Youtube guide to bibliometrics https://www.youtube.com/watch?v=BrAjhZH33XA&t=15s
Manual for Bibliometrix: https://cran.r-project.org/web/packages/bibliometrix/bibliometrix.pdf
(see page 65 for how to clean data)
How to animate the data: https://cran.r-project.org/web/packages/googleVis/vignettes/googleVis.pdf
https://cran.r-project.org/web/packages/googleVis/vignettes/googleVis_examples.html
https://www.rdocumentation.org/packages/googleVis/versions/0.6.0/topics/gvisMotionChart